What makes a swing state? The obvious characteristic is if the state is prone to switching which party it votes for in Presidential elections. If a state doesn’t switch in recent history, then it’s probably not a swing state. More technically is how close the Dem:GOP margins are. If a state, in recent history, has frequently had Dem:GOP margins within 5-6% or so, then it’s "competitive", and thus a likely "battleground" state, liable to "swing" and change which party it voted for since the last election. As computed in the accordion below, if a typical state has about 4.6m people (since this is the population of the two median states, that means means 23 states have more population, 23 have less), and making rough national-level calculations about age, non-citizen immigrants, felonies, and state-level voter turnout, we find this is about 129k people in a "typical state". And finally, a swing state typically has a substantial amount of EVs in the Electoral College. This criteria is a bit softer (Nevada is considered a swing state today, with only 6 EVs; the minimum possible is 3), but important nonetheless.
How many votes is 6% in a typical state? Let’s look at two states with the median population (that is, if we sort states by their population, the two states which would be in the middle), Louisiana and Kentucky, both with approximately 4.6m people. Overall, about 78% of Americans are 18 years or older, and thus eligible to vote. Further, according to Pew, about 47.8m people in the US (in 2023) were foreign-born - 14.3% of the US population - and 23.4m of those (49%) were naturalized citizens. So 7.3% of the population are non-citizens, or by complement, 92.7% are citizens. Thus, we can roughly assume 92.7% of the 78% voting-age-eligible population are eligible to vote - that is, 72.3% of the population. There’s another twist, because felons’ voting rights vary state-to-state. According to the Prison Policy Initiative in 2023 (date found by looking at snapshots in the Wayback Machine), about 19m in the US (about 5.7% of the 2023 population, estimated at 334.9m) have ever been convicted of a felony. It seems in most states felons lose their vote eligiblity only while incarcerated/have-to-finish-sentence (the exceptions being AZ, WY, NE, IA, KY, VA, TN, MS, AL, FL, DE; 6/11 of these south of the Mason-Dixon line). Overall, I’m not an expert, but the vast majority of those currently in prison have a felony conviction, whereas those in jail are either not-yet-convicted, or have a misdemeanor conviction. According to the Prison Policy Initiative, there are 1.9m people incarcerated in the US, and 550k are in local jail, and thus 1.35m in prison or federal jail (they don’t disaggregate "Federal Prisons & Jails" (208k people), so probably slightly over-estimating the prison population (as opposed to the jail+prison system)). Thus, about 0.4% of the US population is in prison; assuming most of them have felony convictions, that means about 72.3% - 0.4% = 71.9% of the population is eligible to vote.
Since most states only rescind the voting eligibity for felons while in prison or serving their sentence, let’s assume our "typical state" is such a one (We are using Kentucky population here for its median (~representative) state population, and while its eligibity restrictions continue beyond incarceration/sentence-served, we aren’t actually looking at Kentucky specifically, just using it to get an idea of the typical state population). Thus, about 0.719*4.6m = 3.31m in our "typical state" are eligible to vote. In terms of state-by-state voter turnout, per University of Florida Election Lab, most states in 2016 had turnout between 60-70%. So let’s say, roughly, a typical state has 65% voter turnout (the national turnout value will differ, because different states have different populations). In other words, about 0.65*3.31m = 2.15m people in our typical state are expected to vote in a given year. If our "swing margin" is 6%, that means the difference between the vote share of the Democrats and GOP is 6%. So we can just compute how many votes that is: 0.06*2.15 = 129k. Thus, in a "typical state", if it’s Dem:GOP margin is within 6% somewhere betwen 0 to 129k voters need to "change their minds" (this is ignoring the fact that people die, non-voters decide to vote, young people age-in to eligibility, and so on; but let’s keep it simple).
Notably, the plurality of stats (n = 24) have a population between 0 and 4.9m; the mode is roughly 1.56m. In this case, 1.12m would be eligible to vote, 728k would vote, and the 6% would be 44k votes. However, such a low-population state would probably have about 4 EVs, and thus probably not a swing state though.
If it’s before Nov 5th 2024 then, let’s say our assessment of the "battleground states" should look at states which have flipped parties within the past four elections (2004 → 2008, 2008 → 2012, 2012 → 2016, 2016 → 2020). These would be:
- Indiana - flipped twice (2008, 2012)
- Colorado - flipped once (2008)
- North Carolina - flipped twice (2008, 2012)
- New Mexico - flipped once (2008)
- Michigan - flipped twice (2016, 2020)
- Wisconsin - flipped twice (2016, 2020)
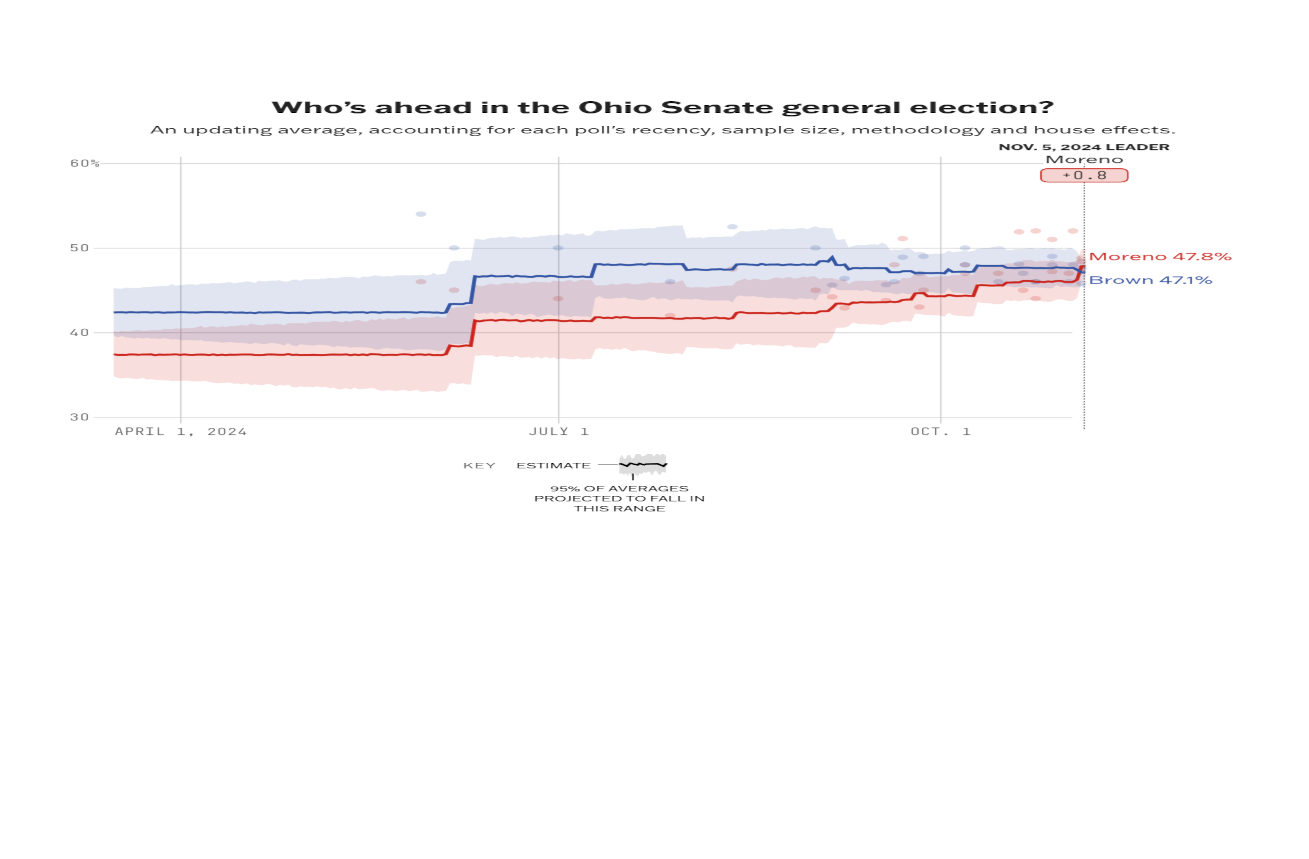
- Ohio - flipped twice (2008, 2016)
- Pennsylvania - flipped twice (2016, 2020)
- Iowa - flipped twice (2008, 2016)
- Virginia - flipped once (2008)
- Georgia - flipped once (2020)
- Arizona - flipped once (2020)
- Nevada - flipped once (2008)
- Florida - flipped twice (2008, 2016)
Of these, actual margins are important. I’ll report these below as x/𝑥 (margins from [0,6%]), a/𝑎 (margins from (6%,12%]), b/𝑏 (margins from (12%,18%]), c/𝑐 (margins from (18%,24%]), and d/𝑑 (margins from (24%,30%]). The italic letter means that year the margin favored Democrats, and non-italic means favored the GOP. I’ll also capitalize the letter, if that year the state "swung" from one party to the other.
- Indiana - 𝑋Acb
- Colorado - 𝐴𝑥𝑥𝑏
- North Carolina - 𝑋Xxx
- New Mexico - 𝐵𝑎𝑎𝑎
- Michigan - 𝑏𝑎X𝑋
- Wisconsin - 𝑏𝑎X𝑋
- Ohio - 𝑋𝑥Aa
- Pennsylvania - 𝑎𝑥X𝑋
- Iowa - 𝐴𝑥Aa
- Virginia - 𝐴𝑥𝑥𝑎
- Georgia - xax𝑋
- Arizona - aax𝑋
- Nevada - 𝐵𝑥𝑥𝑥
- Florida - 𝑋𝑥Xx
So we can see that in at least one of 2016 or 2020, Indiana and Colorado is far from swing-margins; New Mexico, Ohio, Iowa, and Virginia were somewhat far. And North Carolina, Michigan, Wisconsin, Pennsylvania, Georgia, Arizona, Nevada, and Florida were within our "swing" margins. These are the states that were largely considered swing states this year, except Florida.
Yet there’s a lot more to elections than just "swing". If we look at the change in margins, 27 states saw the pattern →2008:Dem → 2012:GOP → 2012:GOP → 2020:Dem. Of these, the NE, IN, MT, and ND saw the biggest swing in 2008 of 18%-24%; in no year since was the swing as big. In CO, NC, NM, OR, VT, ID, DE, MI, WI, SD, the 2008 swing was 12%-18%; in no year since was the swing as big. In CT, NH, SC, MN, OH, PA, RI, ME, IA, WY, and MO, the 2008 swing was 6-12%; in MN, OH, PA, and RI, the 2016 swing was in the same range. And in AL and KY, the swing was 0-6%; in KY, the swing towards Trump was even larger, in the 6-12% range.
Four states saw the pattern → 2008:Dem → 2012:Dem → 2016:GOP → 2020:Dem. Of these, NY, NJ, MS saw a 2008 swing of 6-12%; only in MS was the 2016 in the same range. In Alaska, the 2008 swing was in the 0-6%, only outmatched by the swing in 2012, in the 6-12% range.
Seven states saw the pattern → 2008:Dem → 2012:GOP → 2016:Dem → 2020:Dem. Virginia saw the biggest swing towards Obama in 2008, in the 12-18% range. TX, GA, WA, and KS in 2008 were in the 6-12% range. Of these TX saw a later comparable swing, a 6-12% swing towards Clinton in 2016. KS saw a comparable swing towards Romney in 2012. MA, AZ, and KS saw a 0-6% swing towards 2008 Obama; MA saw a comparable swing towards Biden in 2020.
MD saw the pattern → 2008:Dem → 2012:Dem → 2016:Dem → 2020:Dem, with the 2008 swing to Obama in the 6-12% range comparable to the 2020 swing to Biden.
Three states saw the pattern → 2008:Dem → 2012:GOP → 2016:GOP → 2020:GOP. Hawaii saw a huge gain for Obama in 2008, in the 36-42% range. In NV and FL, no comparable swing happened since.
Three saw the pattern → 2008:Dem → 2012:GOP → 2016:Dem → 2020:GOP. Only in Utah was there a larger swing than the 2008 one, in 2012 (it was Mormon Romney running), and in 2016 in the 24-30% range away from Trump (I think this is due to the third party candidate from Utah).
Three states saw the pattern → 2008:GOP → 2012:GOP → 2016:GOP → 2020:Dem. All of these had a 2008 swing in the range of 0-6% to the GOP; only in West Virginia has the swing level exceeded that, in 2012 and 2016 (in the 12-18% range). One state saw the pattern → 2008:GOP → 2012:Dem → 2016:GOP → 2020:Dem, LA, and the swings have all been in the 0-6% range. One state saw the pattern → 2008:GOP → 2012:GOP → 2016:GOP → 2020:GOP, AR; it’s biggest swing was in 2008 in the 6-12% range, away from Obama.
The interesting cases are those where there were each year saw a swing. That would be CA, IL, UT, LA, NE, IN, MT, ND, CO, NC, NM, OR, VT, ID, DE, MI, WI, D, CT, NH, SC, MN, OH, PA, RI, ME, IA, WY, MO, AL, and KY. That’s 31 states. In fact, only two states saw gains for only one party in all four elections (MD and AR). Looking at our 2024 swing states, FL and NV saw DGGG, GA and AZ saw DGDD, and NC, MI, WI, PA, IA saw DGGD.
Considering the huge changes Obama could pull off in 2008 (and this ground generally eroding slow in 2012), it’s worth wondering how useful the "swing state" idea is. In NE, IN, MT, ND, CO, NC, NM, OR, VT, ID, DE, MI, WI, SD, VA, TX, GA, WA, KS, MD, HI, NV, CA, IL, and UT, he saw greater-than 12% increase in margins in favor of him. This translated to wins in states that voted Bush in 2004 - IN, CO, NC, NM, OH, IA, VA, NV, and FL. Certainly he was helped by the utter Bush failures 2005-2008, but we remember him not as "lesser of two evils", but a candidate people really believed in, due to his message about things like healthcare reform. Further, if the 2008 margin gain for Obama was applied to the 2020 margin in Trump-won states, the Dems would win:
- TX (2004→2008: +11.16%; required: +5.58%)
- IN (2004 → 2008: +21.71%; required: +16.07%)
- NC (2004→2008: +12.76%; required: +1.35%)
- IA (2004→2008: +10.2%; required: +8.2%)
- FL (2004→2008: +7.83%; required: +3.36%)
- MT (2004→2008: +18.24%; required: +16.37%)
OH is close, at -1.33% as a result (2004→2008: +6.7%; required: +8.03%).
Of course, there’s a lot of things different about 2004 → 2008, and 2020 → 2024. But this breakdown perhaps shows some of the issues in the "swing state" concept. And that is... if you tap into issues that voters actually care about, rather than simply fortifying the partisan lines, you can make enormous gains in "non swing states", while also winning all the "swing states", as Obama did in 2008. In fact, in multiple states (WA, NM, OR, TX, NH, MN, NV, ME, VA, GA, NC, VT, MD, HI, CA, DE, IL, AK, SC, UT, and ID), the vote substantially and near-permanently shifted more pro-Democrat in 2008 and most/all elections since (in AR, TN and LA, it did the opposite). Maybe if someone kept doing that, we wouldn’t have to worry about this swing state nonsense? And as far as "swing states" goes, it seems there’s something important about 2008 that put former GOP strongholds AZ, NV, GA, and NC in play as "swing states".